
KPIs and dashboards
Shared definitions, filters, comparisons, and targets for each management level.
A platform unifying sales, finance, customer, and operations metrics through interactive dashboards, alerts, and forecasts for better decisions.
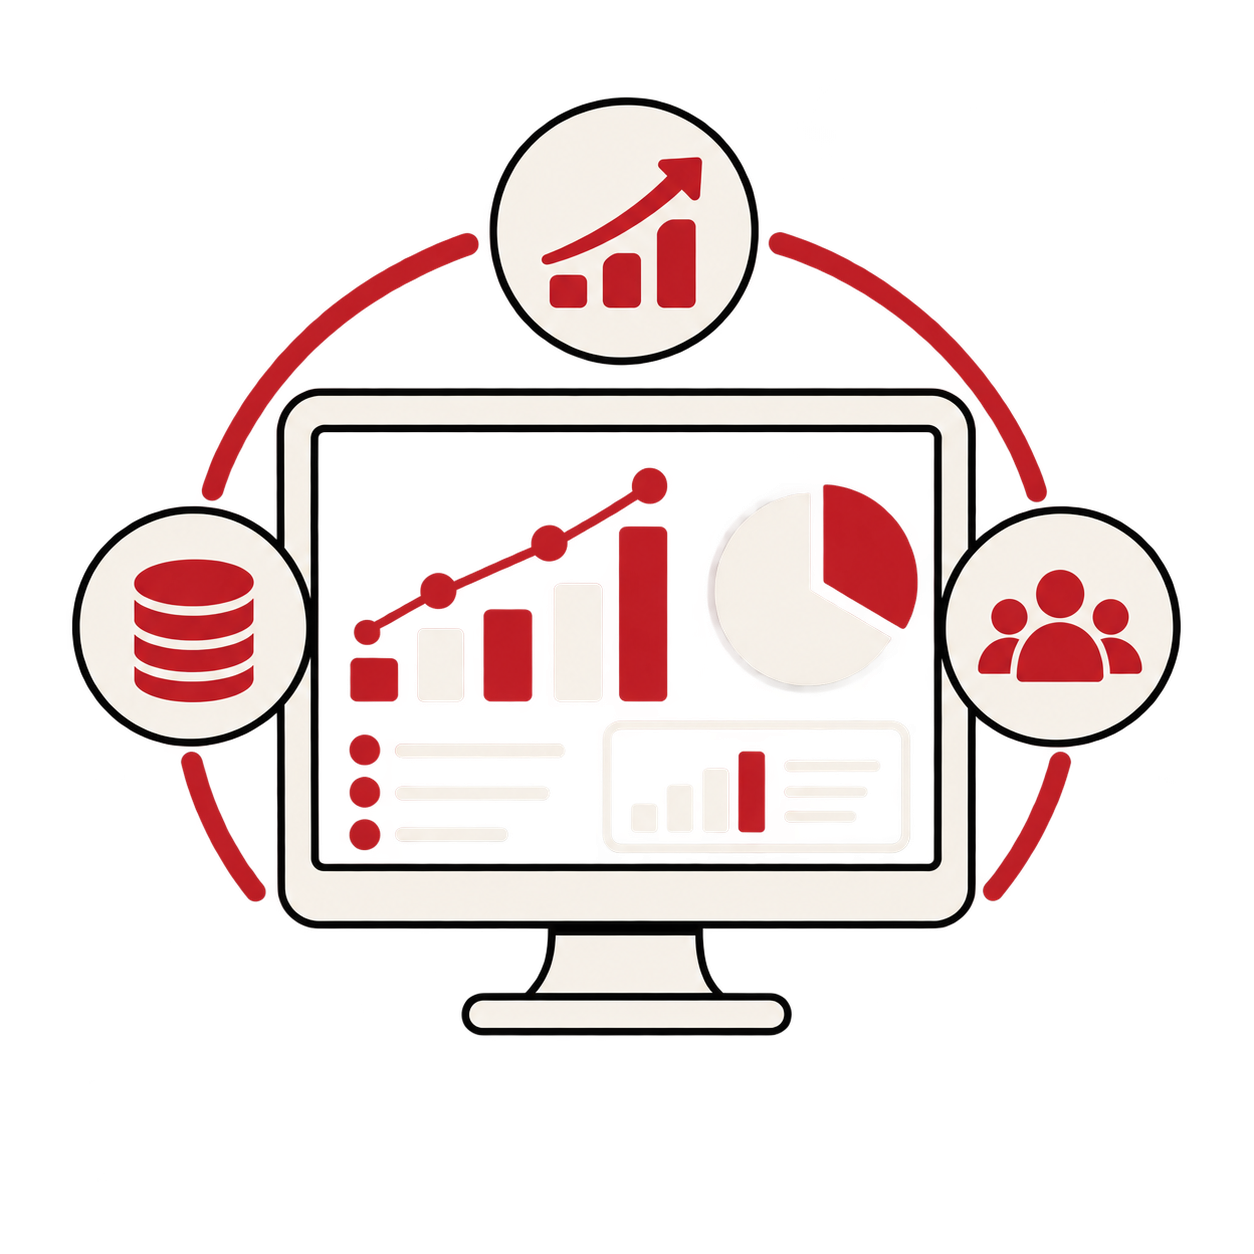
We define decisions, questions, metric definitions, sources, and refresh frequency before designing the data model and dashboards.
Alerts, driver analysis, forecasts, and scenarios can be added while preserving drill-down to source detail.
Scope and priorities are tailored to the operating model, existing systems, and available data.
Shared definitions, filters, comparisons, and targets for each management level.
Identify trends and deviations and notify teams when important conditions occur.
Models for demand, sales, or resources with explicit accuracy and assumptions.
Clear stages reduce risk and keep decisions tied to measurable outcomes.
We understand goals, users, operations, and data and define success measures and the first scope.
We map journeys, prototypes, architecture, and integrations and review decisions before full development.
We deliver reviewable increments and test functionality, performance, security, and realistic scenarios.
We prepare deployment, monitoring, and enablement, then use results to prioritize the next stages.
Success is measured by improvements to user experience, operations, and decisions.
Reach metrics, context, and supporting detail in one location.
Shared definitions reduce time collecting numbers and debating validity.
Alerts and trends help address deviation before it becomes larger.
Yes. An integration and shared modeling layer connects metrics to sources with quality and refresh rules.
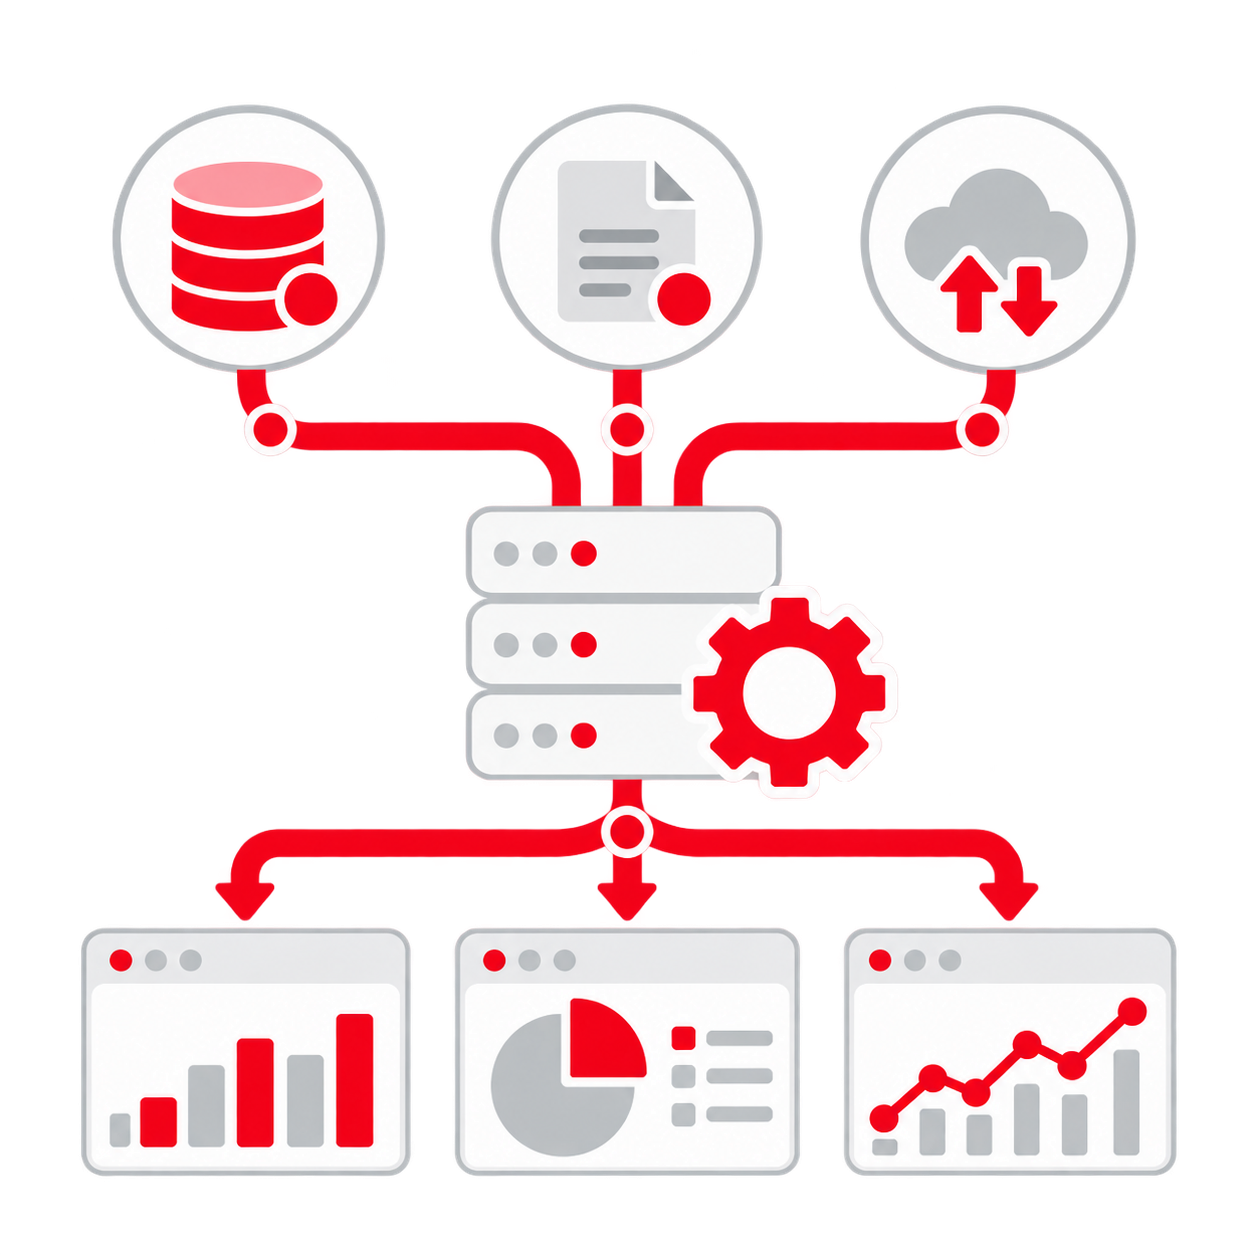
We unify data and build pipelines, warehouses, and analytics that turn fragmented numbers into dependable information for decisions and AI.
Organizations with data spread across systems and files that need unified metrics or an analytics and AI-ready foundation.
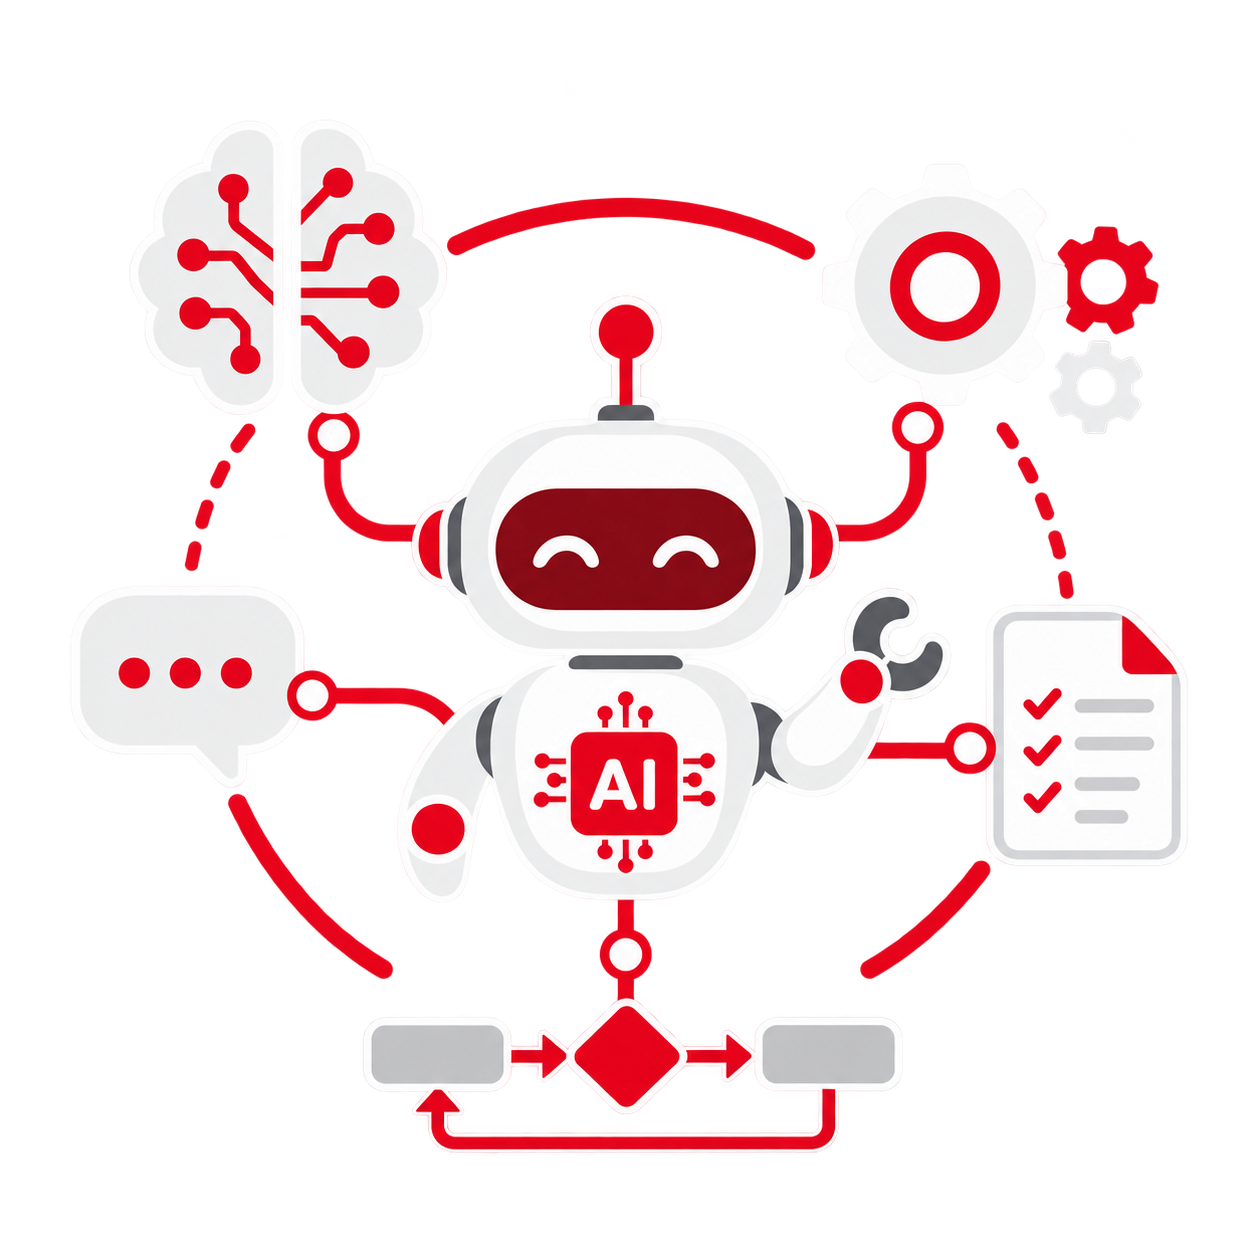
We turn AI into practical products: intelligent agents, knowledge search, document processing, prediction, and automation connected to your systems.
Teams reducing repetitive work or turning internal data and knowledge into governed, measurable AI applications.
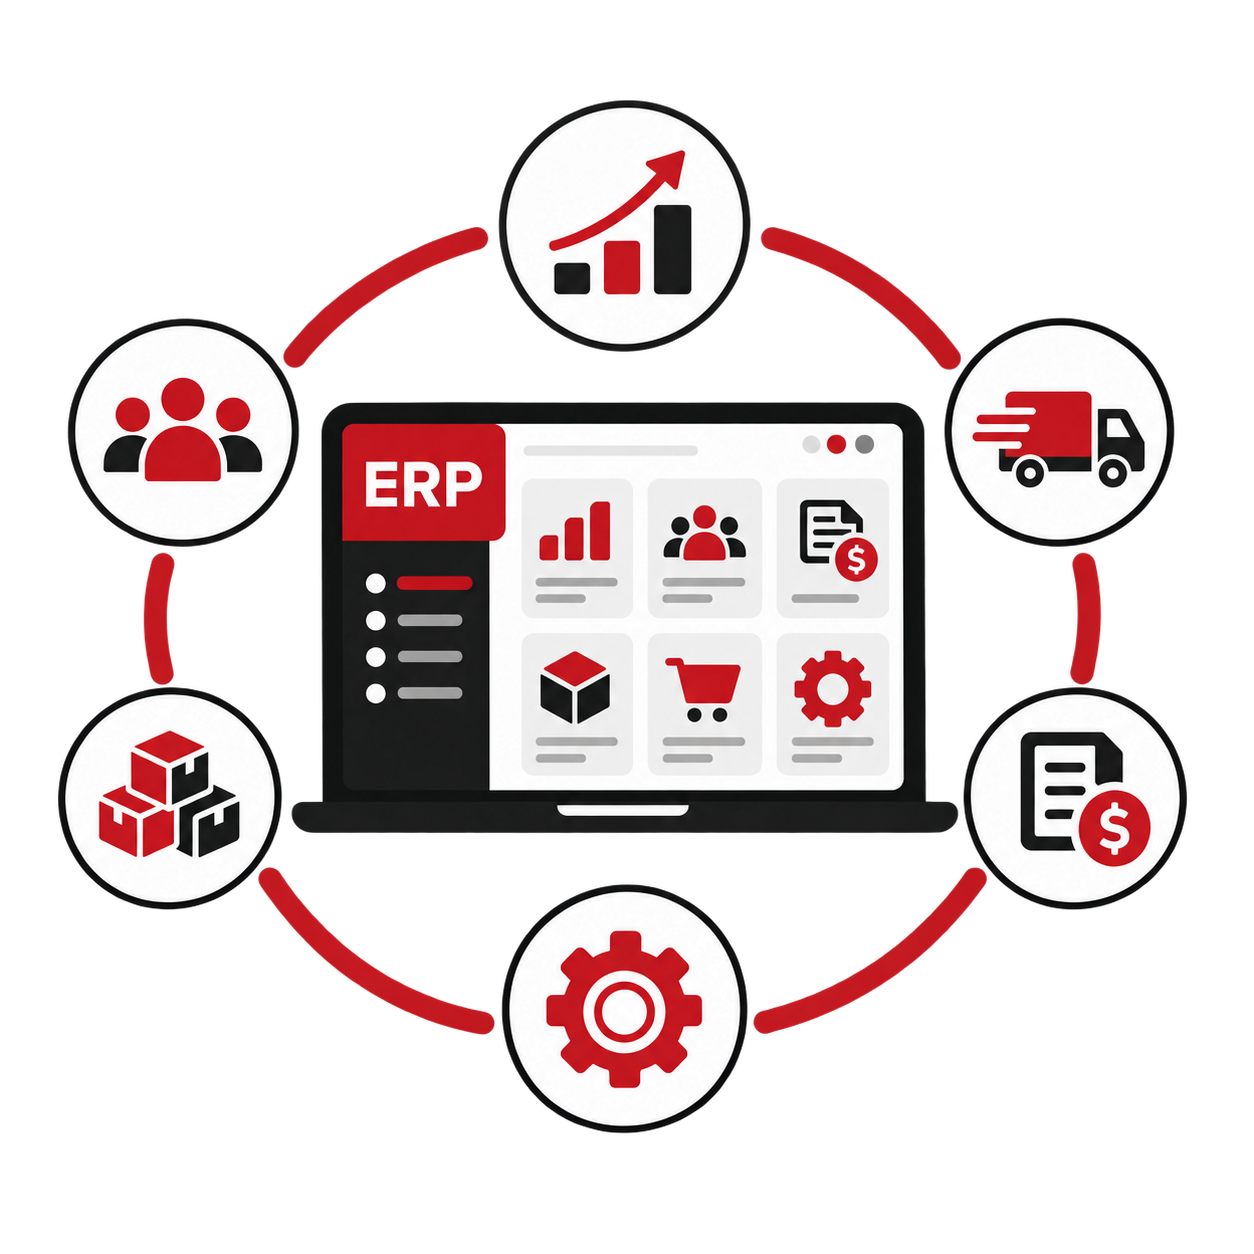
A flexible ERP solution connecting sales, purchasing, inventory, finance, people, and operations through shared data, permissions, and reporting.
Growing, multi-department, or multi-branch organizations managing resources and operations in one configurable integrated system.
Share your goals, current operations, and constraints, and we will help define a practical, measurable scope.